For interactive analyzing cellular automata you can use Python. Rule 30 is an easy example. It is a two state CA. To calculate the next value for the cell q you can use this expression: (p xor (q or r)), where "xor" and "or" are bitwise binary operators and p is the cell left to q and r is the cell right to q. The following Python class calculates one line for Rule 30:
from Numeric import *

class Rule30:
  def __init__(self, length):
    # create arrays
    self.current = zeros(length, Int)
    self.workspace = zeros(length - 2, Int)

    # create slices
    self.left = self.current[:-2]
    self.right = self.current[2:]

  def step(self):
    # calculate the new values using bitwise operators
    self.workspace[:] = self.left ^ (self.current[1:-1] | self.right)

    # update current
    self.current[1:-1] = self.workspace
Then you can use Tkinter and the Python Image Library to display some steps of the automaton:
from Tkinter import *
from ImageTk import PhotoImage
import Image

# create the Rule 30 object and init the middle to 1
length = 500
rule30 = Rule30(length)
rule30.current[length / 2] = 1

# create the image array
lines = length / 2
imageArray = zeros((lines, length), Int)
for step in range(lines):
  imageArray[step, :] = rule30.current
  rule30.step()

# init tk
root = Tk()
root.title('Rule 30')

# convert the image array into a PIL image and display it
img = Image.fromstring('L', (length, lines), ((1 - imageArray) * 255).astype(Int8).tostring())
photo = PhotoImage(image = img)
label = Label(image = photo)
label.pack()
root.mainloop()
Here's the full source-code, with the rule30 definition: rule30image.py
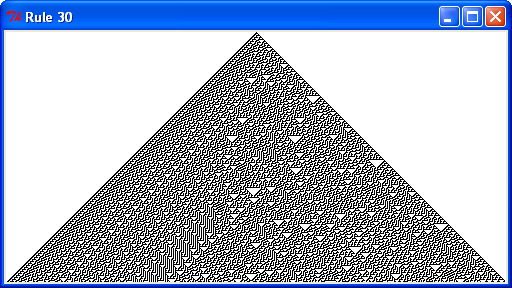
You will see this picture:

If you want to count the number of 1's in each line, you can write something like this:
# create the Rule 30 object and init the middle to 1
length = 10000
rule30 = Rule30(length)
rule30.current[length / 2] = 1

# print the number of '1's for all automaton steps
for step in range(length / 2):
  print sum(rule30.current)
  rule30.step()
Here's the full source-code, with the rule30 definition: rule30.py
You can redirect to output to a file (wait some minutes for all 5000 steps):
python rule30.py > ones.txt
Then you can paste ones.txt to a spreadsheet and plotting some charts.
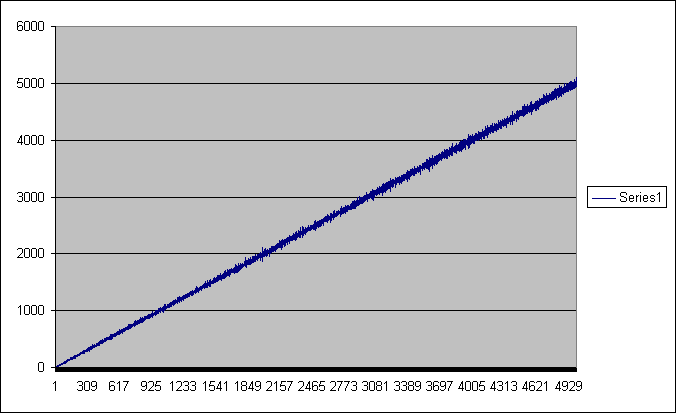
All 5000 values (ones.txt):

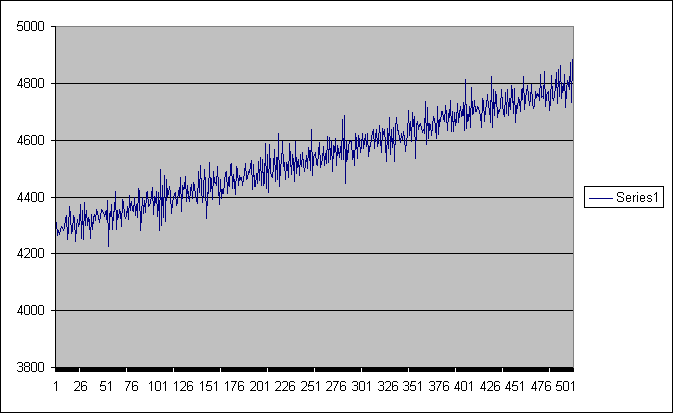
An interval near the end:

This was tested with Python-2.2.2.exe, Python Imaging Library 1.1.2 for Python 2.2b1 and Numeric-23.0.